Smithville’s Spending Rose 3.4x in 7 Years: Where Did Your Tax Dollars Go?
In fiscal year 2023-24, paying for all city services added up to $17.2 million—the highest budget in Smithville’s history. So where did all that money go?

By Kristen Meriwether, Publisher
As Smithville residents, we pay taxes to the city—property taxes on our homes and sales taxes on purchases within city limits. Beyond taxes, we pay fees for building permits, opening a business, filing FOIA requests, and more—a list that seems to grow at every council meeting. We’re also charged for electricity, garbage, water, sewer, and past city debt on our utility bill.
These funds support services we rely on: paved roads, police and fire services, running water, and recreation, including parks, the rec center, and the library, among many other things. In fiscal year 2023-24, paying for all city services added up to $17.2 million—the highest budget in Smithville’s history.
So where did all that money go?
Get out your calculators, Smithville: It’s time for some Municipal Math.
Each year, the city produces an annual financial report that is reviewed by an independent auditor. Smithville Texas News reviewed those reports, known as the Comprehensive Annual Financial Report (CAFR), from fiscal year 2016-17 through 2023-24. All reports can be found on the city’s website.
Total Government Expenses
Just like you, cities have expenses: payroll for city employees, gas for police cars, paving city streets—the list goes on. But one thing that surprised us was just how much these non-utility expenses have increased in seven years.
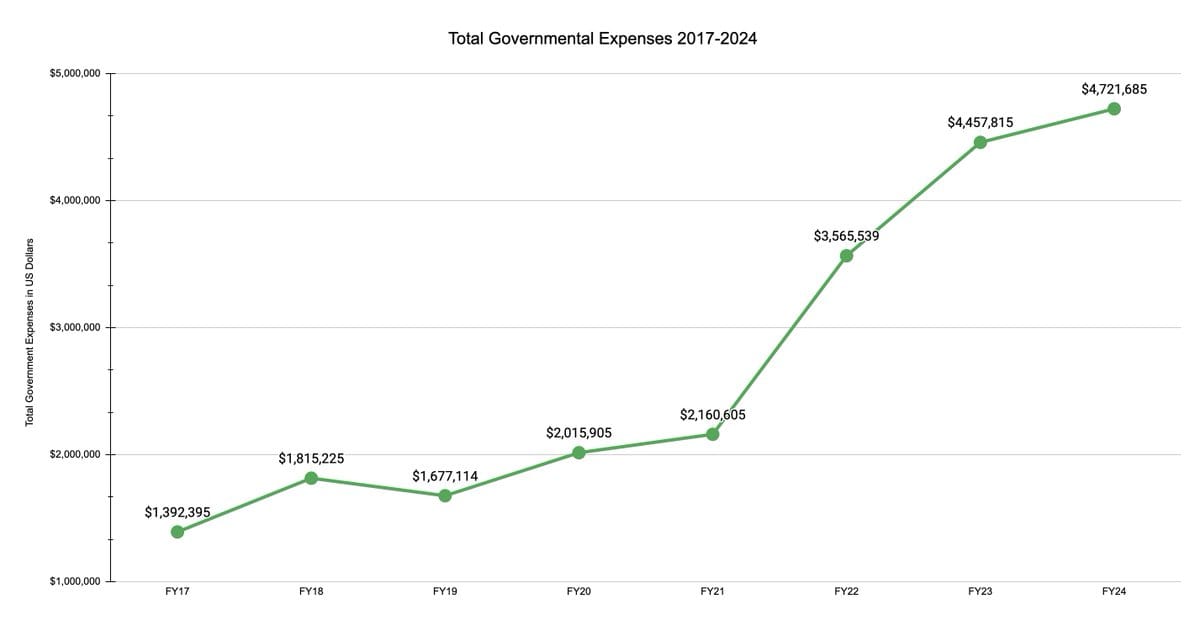
In fiscal year 2016-17, the city’s expenses (excluding the utility fund) were $1.39 million. Seven years later, in fiscal year 2023-24, those expenses ballooned to $4.72 million—a 3.4x increase.
Adjusted for inflation (26.19%), that’s still a 2.7x increase in expenses. Smithville’s population has remained steady at about 3,900 during that time.
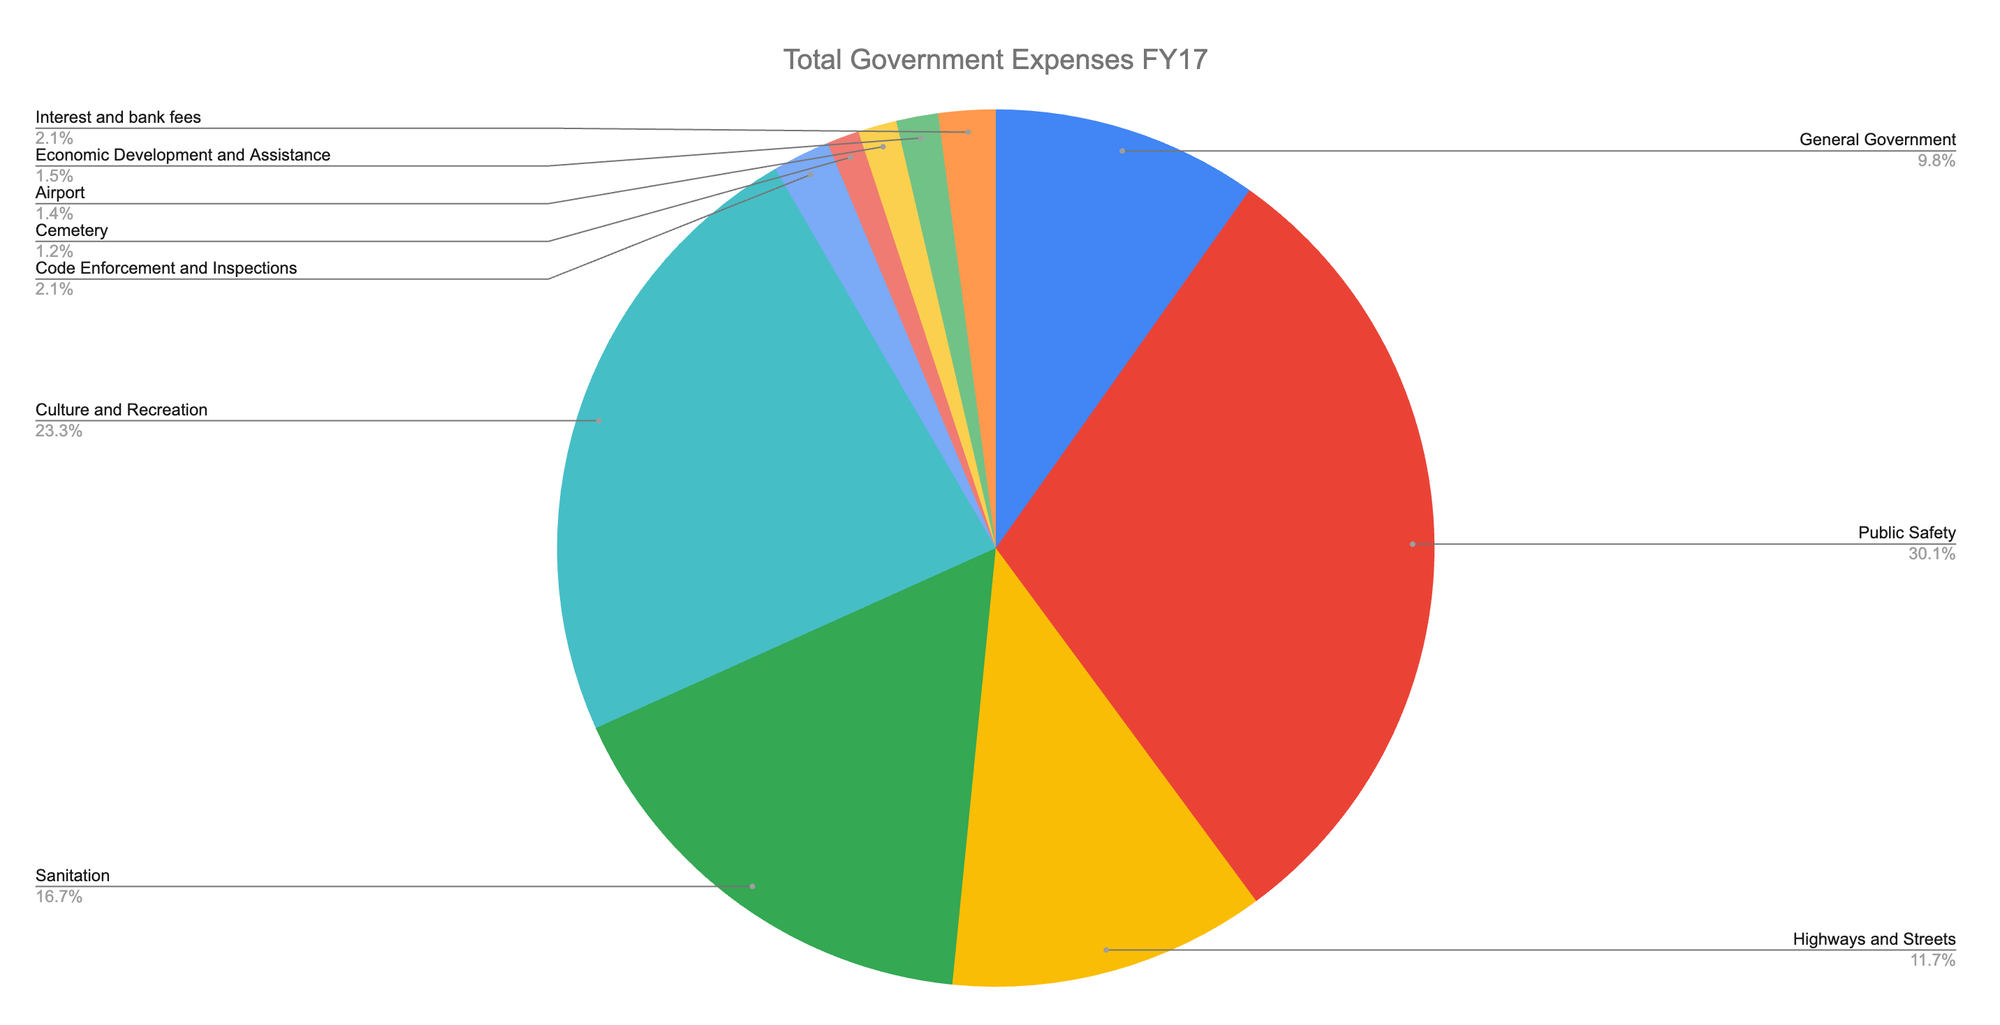
The CAFR breaks down the city’s general fund expenses into 11 categories. Here’s how those categories were allocated in FY 2017:
And here’s how they were allocated in FY 2024:
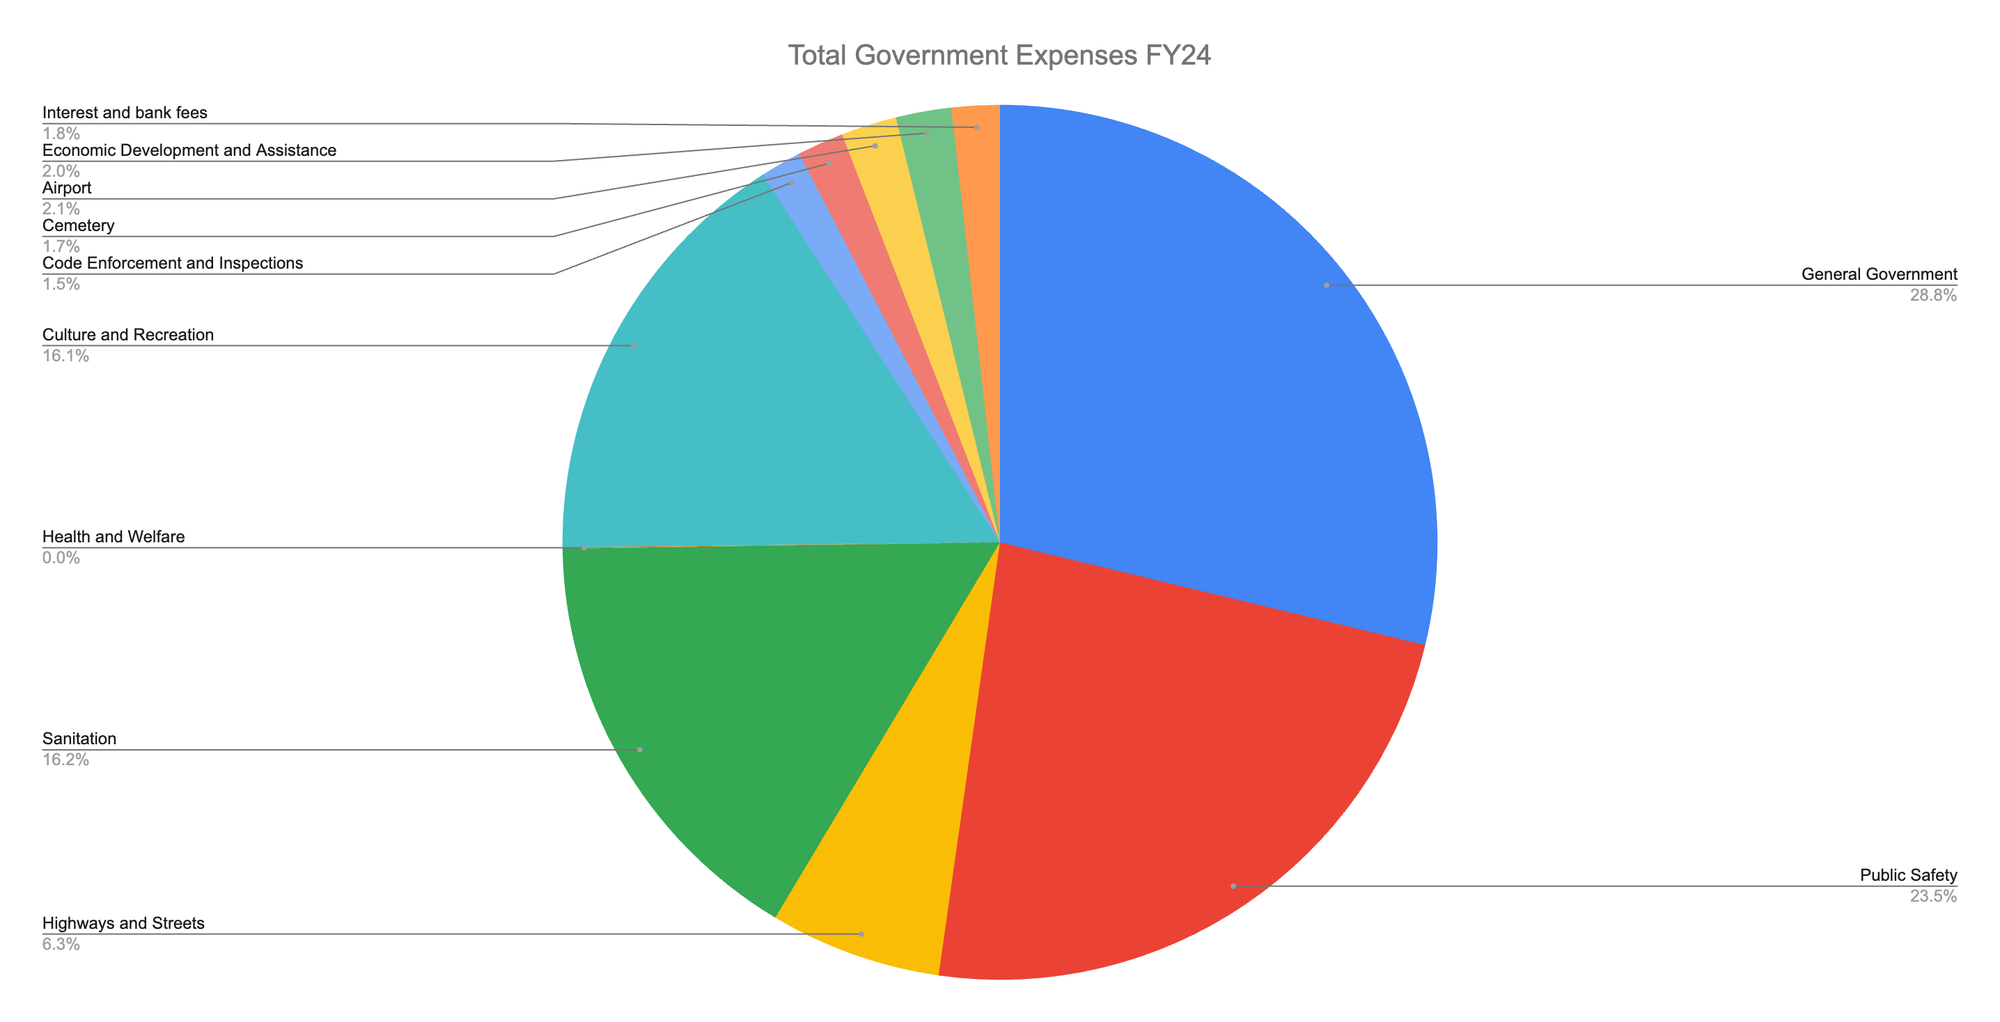
As you can see, the category with the largest growth in those seven years has been General Government, with a nearly 20% increase in its share of total expenses.
We created line graphs for the top five largest categories to show year-over-year growth:
General Government
This category includes general administration (think payroll for city workers and expenses at City Hall), and finance.
The growth from FY17 to FY24 is a 4.9x real increase after adjusting for inflation. Of all categories, this one had the highest growth rate.
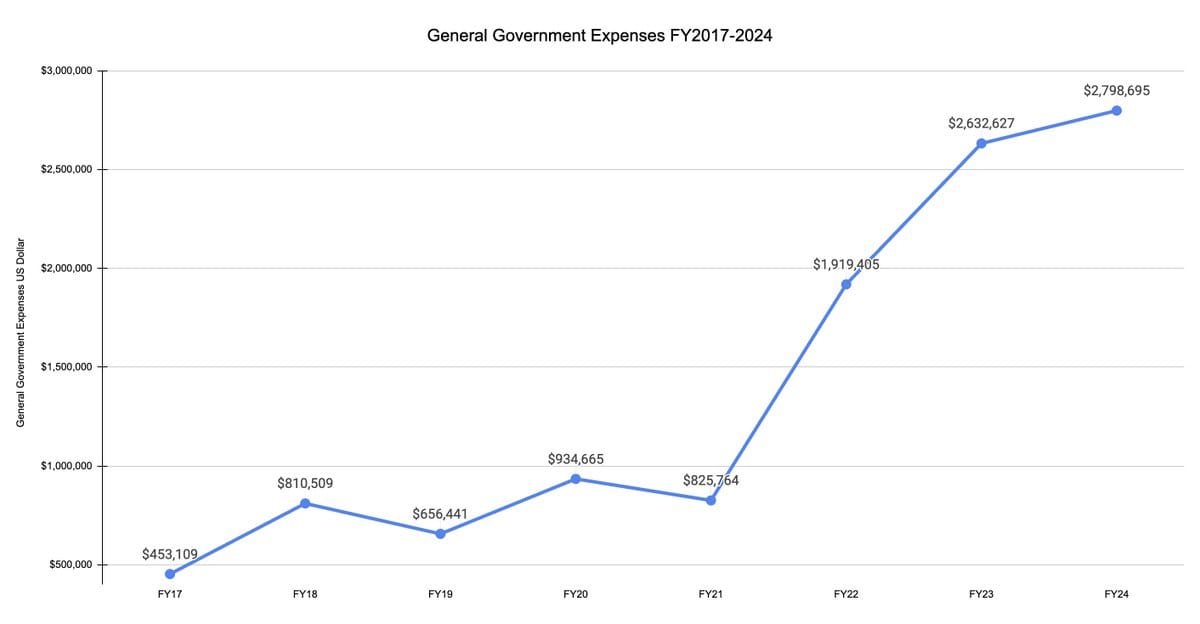
The most dramatic spike, between FY21 and FY22, was due to pay raises given to salary and hourly employees, which made the pay competitive with surrounding areas. Growth from FY23 to FY24 returned to more typical year-over-year growth.
Public Safety
This category includes the Smithville Police Department, Animal Control, the volunteer fire department, and the municipal court.
Public Safety is the second-highest expense category behind General Government, but its growth rate is among the lowest, at a 1.3x real increase after adjusting for inflation.
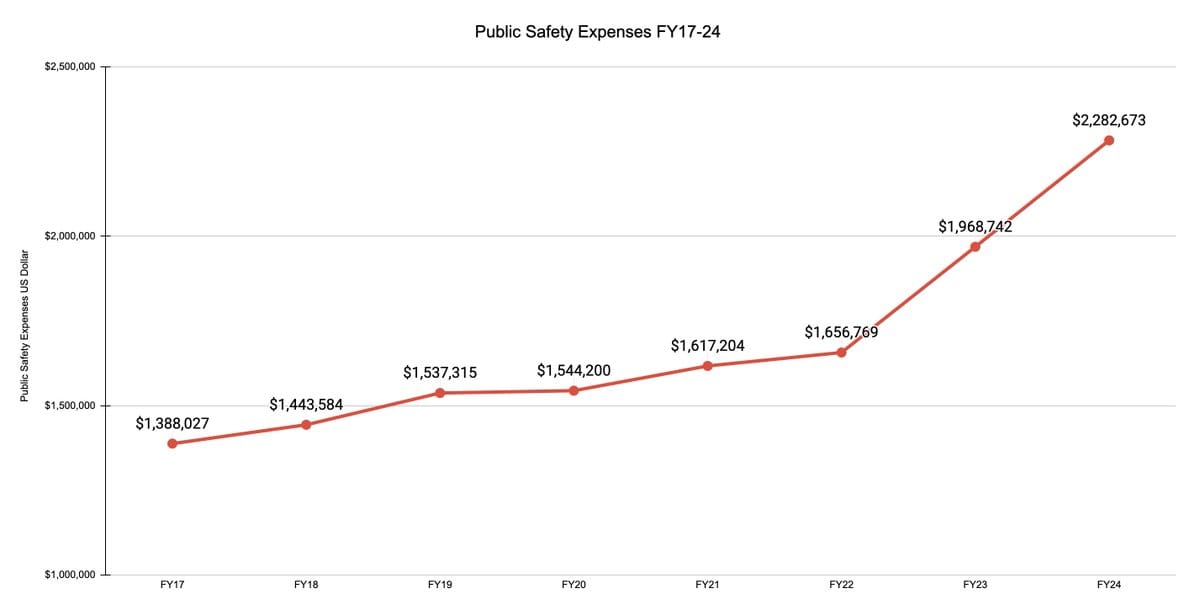
Budget documents for fiscal year 2022-23 show the spike is due, in part, to implementing STEP compensation for the police department, which helped fill open positions.
Culture and Recreation
This category includes the Smithville Public Library, the Smithville Recreation Center, city parks, and community services.
The real growth rate for this category, when adjusted for inflation, is 1.15x, near the bottom of the list.
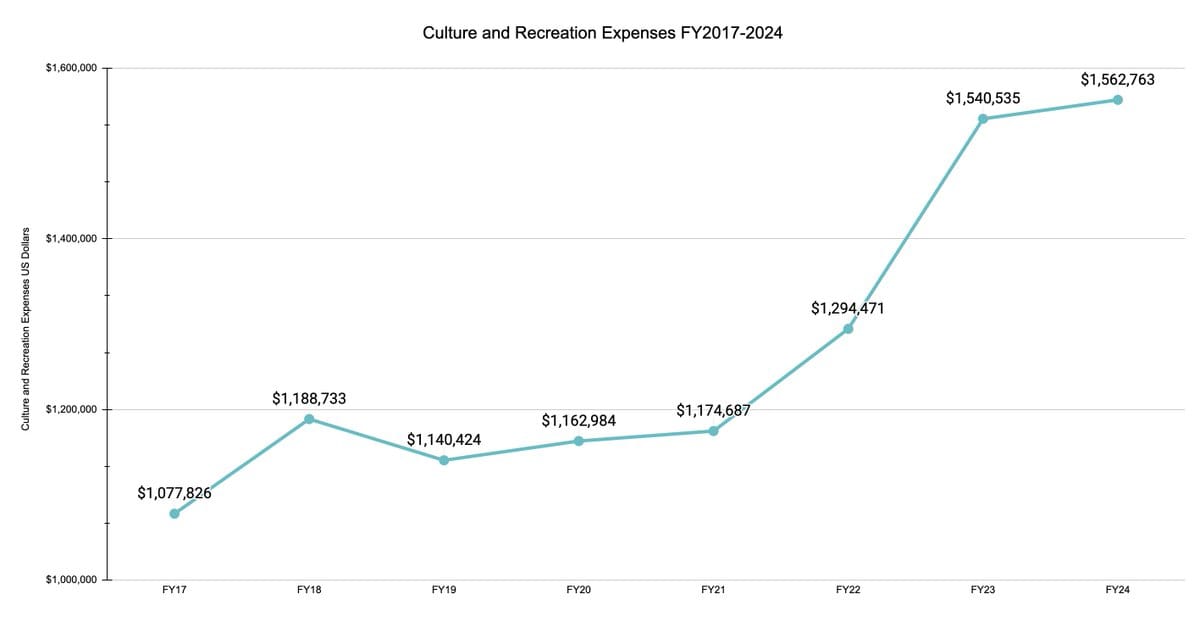
Both the library and the rec center had budgets of nearly half a million dollars each in the current fiscal year budget. According to the CAFRs we reviewed, this category generates about $130,000 in revenue for services annually.
Sanitation
This category includes solid waste (trash pickup) and is the only category that consistently generates nearly enough—or enough—revenue to cover its expenses.
The real growth rate for this category, when adjusted for inflation, is 1.6x, which is in the middle of the pack.
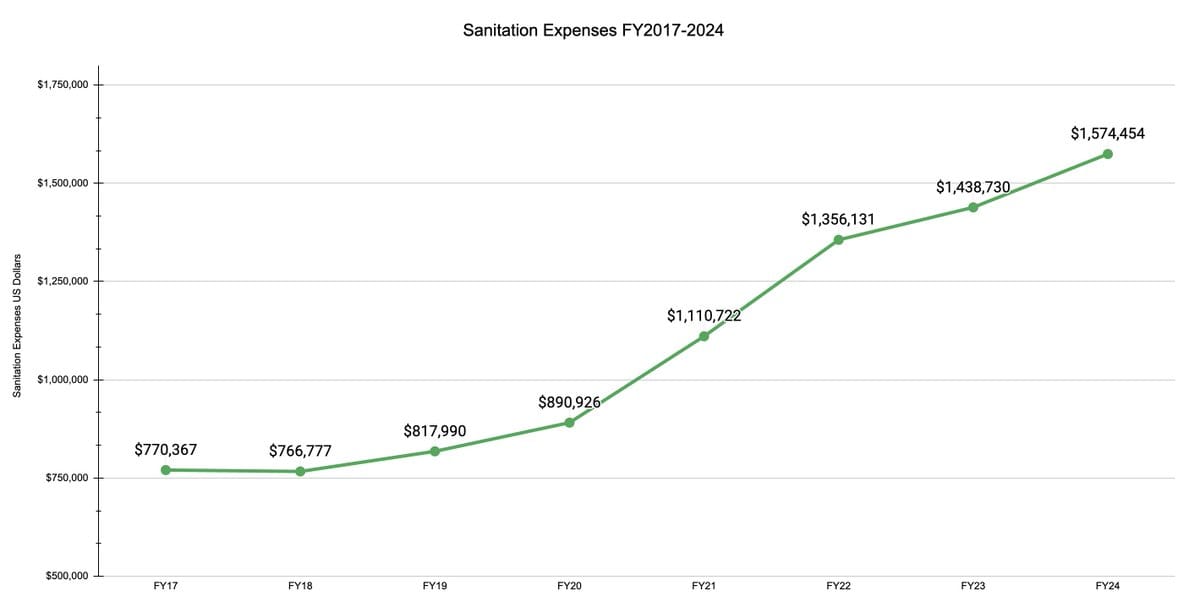
The contract with Waste Management, the city’s garbage collector, expires next year. Currently, the city marks up residential trash carts 51.64%, which helps keep this category at or near break-even.
Highways and Streets
This category includes the maintenance of all city streets and alleyways. This covers everything from repaving roads to filling potholes to providing fill in the dirt alleyways, among other things.
This is the only category that has decreased in the last several fiscal years and, when adjusted for inflation, is actually spending less than in FY 2017.
The real growth rate for this category, when adjusted for inflation, is -0.9x, which is at the bottom.
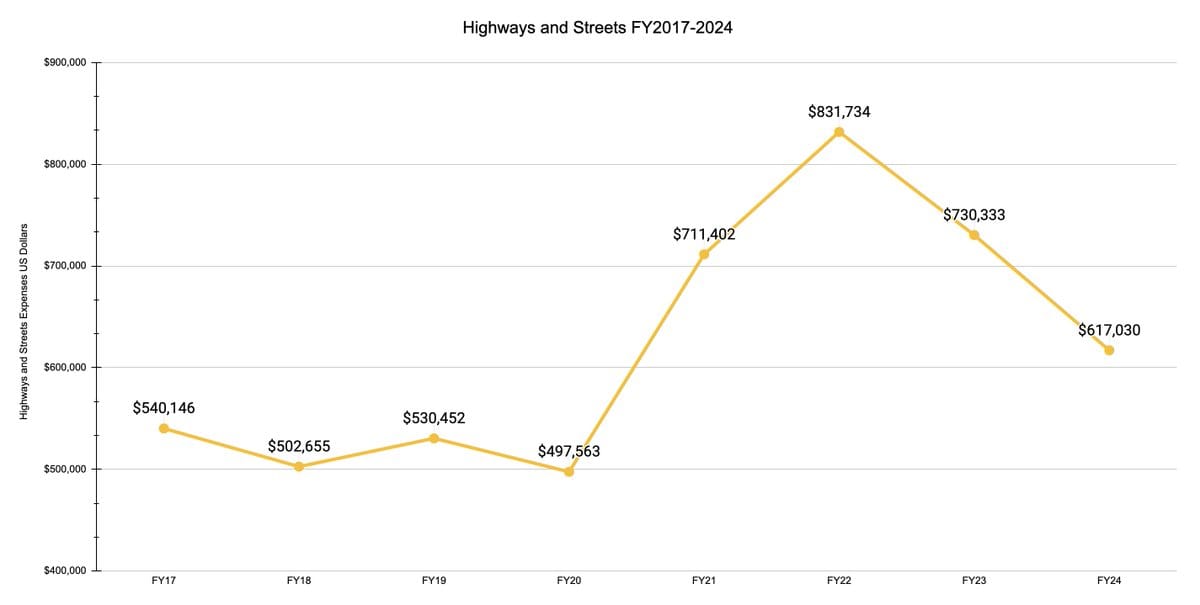
This category is typically offered (and taken) as a sacrifice during budget season.
Other
The other six categories had expenses less than $200,000 each. While each one had an increase in the seven year span, even when adjusted for inflation, the dollar amounts were not as significant as the largest five.
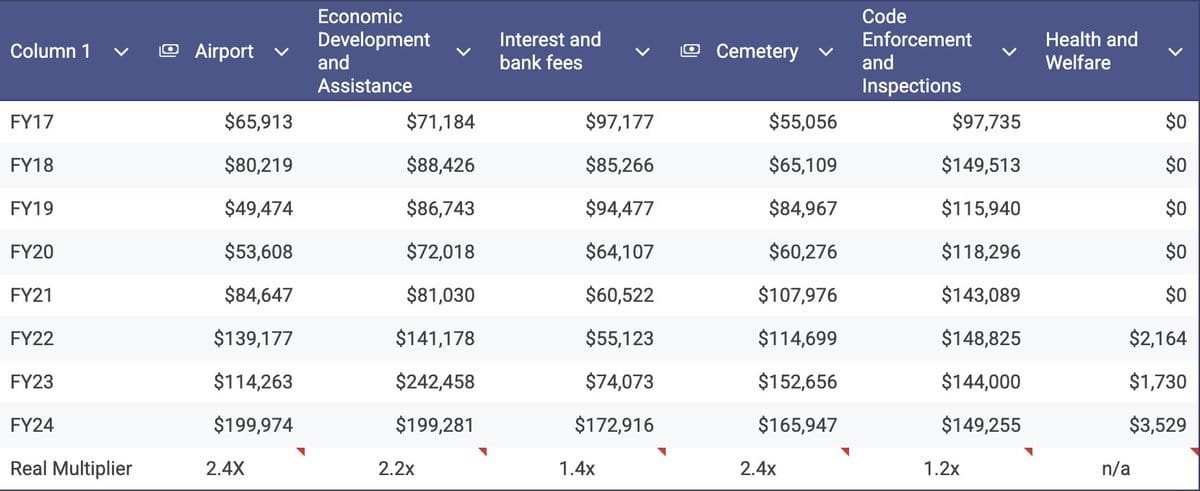
The city has increased their investment in the airport in the last several budgets. You can read our March 26 story on that increased investment here.
Government expenses are one of two funds the city manages in the budget. The Utility Fund, which is used to purchase and sell utilities to residents, is the other.
Look for a story on Utility Fund expenses and why the city has become more reliant on those funds to cover the higher government expenses in our next Municipal Math story.


Comments ()