Analysis: How Smithville's Post-COVID Property Value Surge Masks Debt Vulnerabilities
By Kristen Meriwether, Publisher
Editor's Note Aug. 7, 2025, 10:30 a.m.: This article has been updated to incorporate revised population estimates from the U.S. Census Bureau, including adjustments from the Count Question Resolution (CQR) program, as flagged by the City of Smithville. The original article data from The Texas Bond Review Board used uncorrected census data. Debt per capita has been recalculated, and population trends/snapshots revised accordingly. The core analysis on taxable value surges and debt vulnerabilities remains unchanged. We appreciate the city's input and regret any initial inaccuracies.
As we navigate year five of our post-COVID world, municipal economics is starting to feel the ripple effects we were warned about during the intense housing market activity from late 2020 to mid-2022.
If you’ll recall, the housing market began heating up in late 2020 as mortgage rates bottomed out and remote work fueled demand. Central Texas became a popular landing spot, and for much of 2021, the market reached fever pitch, with homes selling for 20–30% above asking price, often within 24 hours (if they even hit the market at all).
When the Federal Reserve began raising interest rates in early to mid-2022, the boom began to cool. But the rapid value spike created lasting tax and debt implications, a key metric for property tax rates and borrowing ability.
In this analysis, I’ll show the impact on Smithville’s values and how it’s affecting metrics used to determine the city’s borrowing capacity. I am using a dataset called Debt Outstanding by Local Government that uses Bond Review Board data.
It should be noted, the BRB uses taxable values, which exclude exemptions like homestead and over-65, because it reflects the actual tax revenue available to repay debt. Assessed values are used for budgets and to set the tax rate, but they overestimate revenues due to exemptions being included.
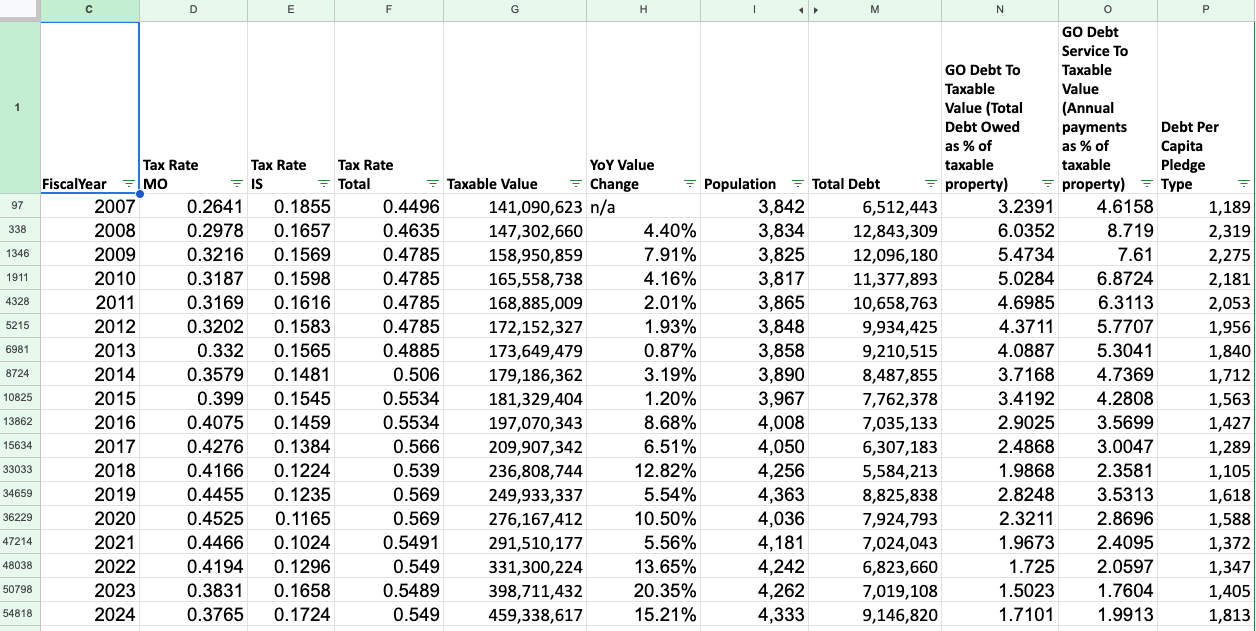
Pre-COVID (2007–2019), taxable value in Central Texas grew ~5% annually (in areas not experiencing massive growth). Smithville averaged 4.94% annual growth in values, with population growing modestly by 521 people (~1% annually).
Here’s a snapshot of the City of Smithville in FY2008:
- Population: 3,834
- Taxable Value: $147.3M
- Debt: $12.8M
- % of Debt to Taxable Value: 6.03%
- Debt per Capita: $2,319
The city did a great job paying off debt between 2008 and 2018, dropping from $12.8 million to $5.5 million, bringing the percentage of debt to taxable value down to 1.98% in 2018, allowing us to borrow again (which we did in 2019).
But post-COVID, Smithville’s home values surged dramatically in a frenzied housing market, averaging 13.05% annual value growth with continued modest population growth of 297 people (~1.8% annually, 2020–2024).
This pandemic-driven spike, fueled by low interest rates and high demand, was a unique moment not likely to repeat. The value spike’s tax and debt impact will linger for years.
Here’s a snapshot of the City of Smithville in FY2024:
- Population: 4,333
- Taxable Value: $459.3M
- Debt: $9.1M
- % of Debt to Taxable Value: 1.71%
- Debt per Capita: $1,813
Our $9.1M in debt in 2024 resulted in a 1.71% debt-to-taxable-value ratio. That's lower than when we only had $5.5M in debt!
Mathematically, this low ratio gives us the green light to borrow again. And we have, taking on $5 million in new debt since 2021 (see on what here):
- 2021: $750K
- 2022: $1.25M
- 2023: $3M
But we have seen modest population growth, limited new home construction since 2021 and start every year taking $1M from the utility fund to cover the general fund. Our sales tax collections have increased, but when adjusted for inflation are below 2022 levels.
City Manager Robert Tamble forecasts $40–50 million in new assessed value from 210 homes, an industrial park, and a Highway 71 truck stop, which could boost revenue over the next few years. But project delays beyond the city’s control have stalled this growth for three to four years already.
As values normalize, the data urges caution: Borrowing more now risks overextension if these projects continue to lag, especially with flat 2025 values and the ongoing strain to the general fund.
Aug. 1, 4:15pm: Editor's not on the data: We used population data included in the dataset Debt Outstanding by Local Governments which pulls from the Bond Review Board for this story. The City of Smithville emailed after this story was published and challenged the population data in the story. Their data shows: “In 2000, Smithville, Texas had a population of 3,901 people. The city experienced a 22.1% increase in population between 1990 and 2000, growing from 3,196 to 3,901, according to the Smithville Comprehensive Plan.” “In 2008, Smithville had a population of around 3,922 people.” “The 2010 US Census data for Smithville, Texas, indicates a population of 3,817.” “The 2020 US Census data for Smithville, Texas, was revised/corrected to reflect a population of 4,062.” We reached out to the BRB to see where they sourced their data, but they have not yet responded. We will update the story as we get more information.
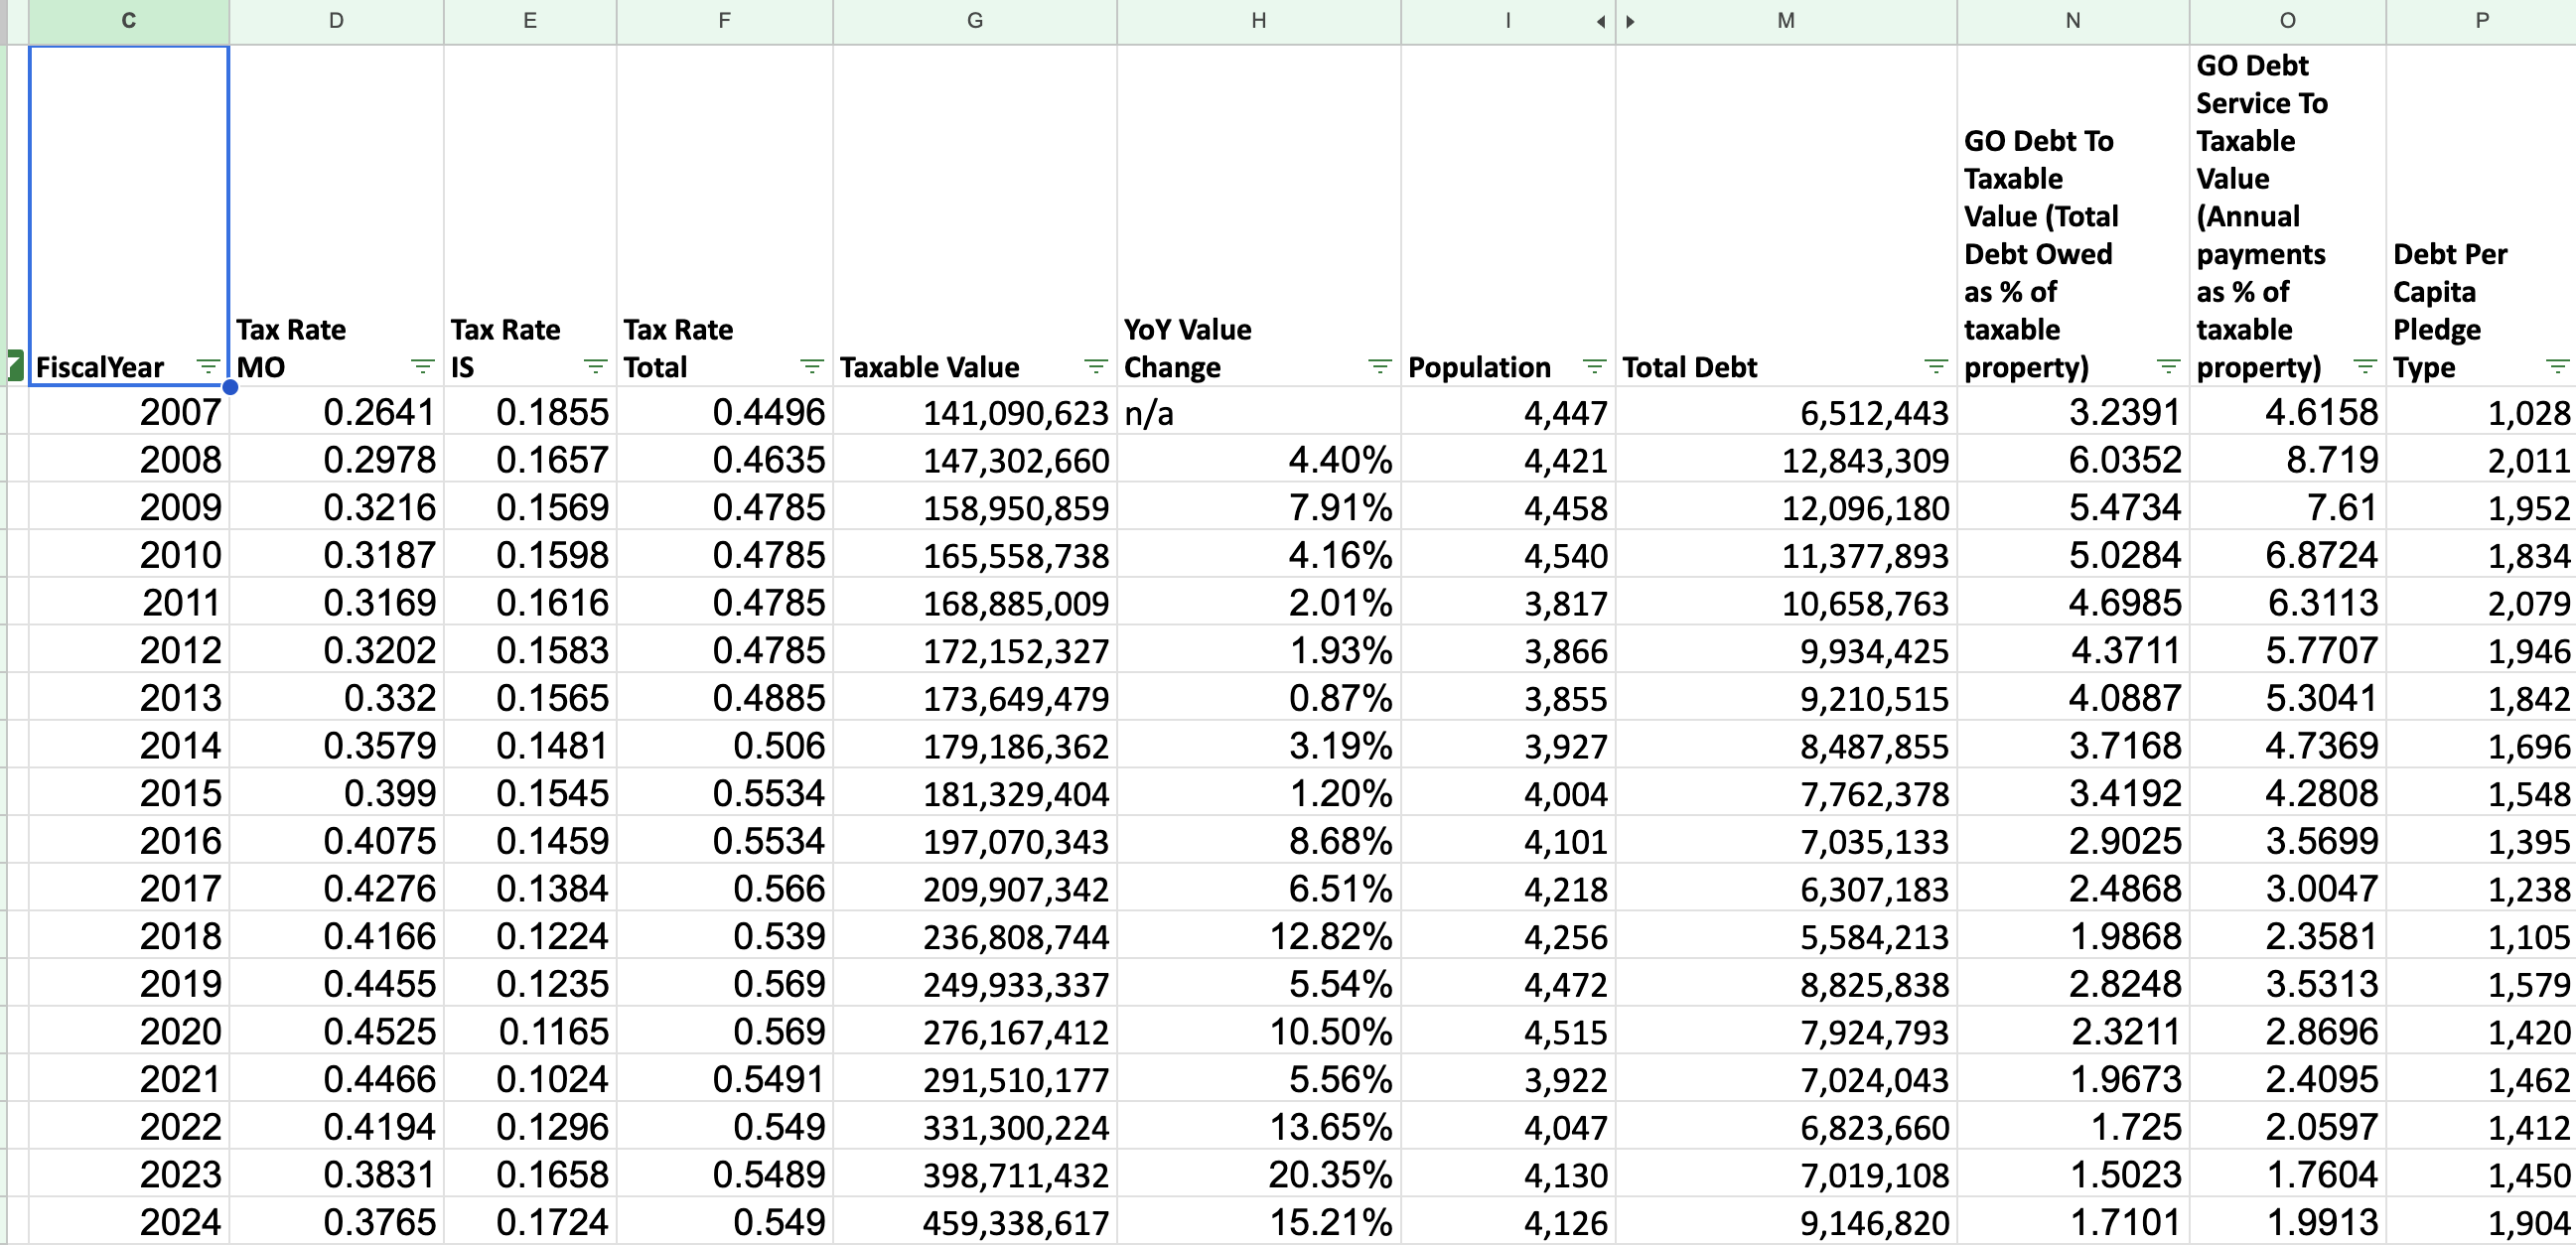
Update Aug 6, 2025, 10:30 a.m.:
Below is the original chart and sections of the article we changed:
Pre-COVID (2007–2019), taxable value in Central Texas grew ~5% annually (in areas not experiencing massive growth). Smithville averaged 4.94% annual growth in values, despite our population increasing by only 25 people (2007–2019).Here’s a snapshot of the City of Smithville in FY2008:
- Population: 4,421
- Taxable Value: $147.3M
- Debt: $12.8M
- % of Debt to Taxable Value: 6.03%
- Debt per Capita: $2,011
But post-COVID, Smithville’s home values surged dramatically in a frenzied housing market, averaging 13.05% annual value growth despite a population drop of 389 people, or 8.6% (2020–2024). This pandemic-driven spike, fueled by low interest rates and high demand, was a unique moment not likely to repeat. The value spike’s tax and debt impact will linger for years.Here’s a snapshot of the City of Smithville in FY2024:
- Population: 4,126
- Taxable Value: $459.3M
- Debt: $9.1M
- % of Debt to Taxable Value: 1.71%
- Debt per Capita: $1,904
Our $9.1M in debt in 2024 resulted in a 1.71% debt-to-taxable-value ratio. That's lower than when we only had $5.5M in debt! And our debt per capita matches levels seen with $11.3M in debt, highlighting the surge’s effect.But we have lost population, built few new homes since 2021, and haven’t measurably increased revenue. In fact, we start every year taking $1M from the utility fund to cover the general fund.


Comments ()